AVAYA DOCUMENTATION CENTER
Find answers to your technical questions and learn how to use our products
Avaya Aura Communication Manager Reports
About customer-supplied (theoretical) data for measurement reports
For an installed system, the measurement reports are always preferred over theoretical data derived from traffic tables. However, the use of traffic tables might be necessary and desirable at times. For example, as a part of responding to a request for proposal (RFP), a potential customer can supply certain traffic data obtained independent of the switch, and request that the RFP include calculations indicating how well the switch accommodates the specified traffic. You might also use traffic tables during the system engineering and planning stage.
Note:
Traffic engineering capacity tables, such as the Erlang-C Infinite Queue, Erlang-C Finite Queue, and Retrial Capacity, are used for data analysis when necessary. Traffic engineering capacity tables are based on mathematical models in which certain assumptions are made about call arrivals, the serving process, and the disposition of blocked calls.
Speed of answer: Given the appropriate variables, you can estimate the speed of answer. You need the following:
-
Erlang-C Infinite Queue capacity tables (found in Basic Traffic Analysis)
-
AWT (average work time)
-
Number of attendant positions staffed (working servers)
-
AOL, where: AOL = (Calls Ans + Calls Aband) X AWT
Example
Given the following data, estimate the speed of answer:
-
Time Talk: 43 CCS
-
Time Held: 4 CCS
-
Calls Answered: 170
-
Using Time Talk, Time Held, and Calls Answered, the calculations indicate AWT: 27.6 seconds.
-
Number of Attendant Positions Staffed: 2
-
Calls Abandoned: 3
-
Using Calls Answered, Calls Abandoned, and AWT, the calculations indicate that AOL:= 47.83 CCS.
-
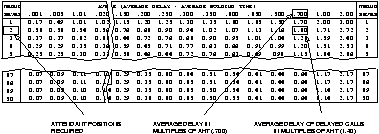
In the table shown in Estimating the speed of answer, locate the row that corresponds to two attendant positions, that is the working servers.
-
Read across to find the offered load closest to 47.83 CCS. (The closest is 46.2 CCS, when rounding up.)
-
Read up to find the Average Delay in Multiples of Average Holding Time that corresponds to 46.2 CCS (for this example, the Average Delay in Multiples of Average Holding Time is 700).
-
Estimate the theoretical Speed of Answer by multiplying the Average Delay in Multiples of Average Holding Time by AWT (that is, Speed of Answer =.7 X 27.6 seconds = 19.3 seconds).Note:This example implies all calls have an average of 19.3 seconds delay. Some of the calls are answered immediately, while the remaining calls are delayed. To find the portion of calls that experience a delay before service can be estimated, use the table shown in Estimating the percentage of delayed calls. The average delay of these calls can be estimated using the table shown in Estimating the average delay of delayed calls.
Figure: Estimating the speed of answer 
-
To determine the percentage of calls that experience a delay, use the Average Delay in Multiples of Average Holding Time that is closest to the expected AOL.
-
In the Erlang-C Infinite Queue Capacity table shown in Estimating the speed of answer, locate the row that corresponds to two working servers.
-
Read across until you find the value closest to the expected AOL (the value closest to 47.83 CCS is 46.2 CCS).
-
Read up to find the Average Delay in Multiples of Average Holding Time that corresponds to 46.2 CCS (the Average Delay in Multiples of AHT is .700).
-
In the Erlang-C Probability of Delay table shown in Estimating the percentage of delayed calls, find the .700 column.
-
Read down this column until it intersects the row with two servers. The value at the intersection is .502, which represents the probability of delay. This value shows that 50.2 percent of the calls experience some delay before being answered.
Figure: Estimating the percentage of delayed calls 
-
-
To determine the Average Delay of the Delayed Calls, proceed as follows:
-
In Estimating the average delay of delayed calls, locate the .700 column.
-
Read down this column until it intersects the row with two servers. (The value at the intersection is 1.40. This value is the Average Delay of Delayed Calls in Multiples of Average Holding Time).
-
To obtain the Average Delay of Delayed Calls in seconds, multiply the Average Holding Time by 1.40 (1.40 X 27.6 seconds = 38.6 seconds).
-
-
In summary, when two attendant positions are provided to accommodate 173 calls during the busy hour, the speed of answer for all calls is 19.3 seconds. While 49.8 percent of the calls are answered immediately, the remaining 50.2 percent have an average delay of 38.6 seconds.
Estimating the number of attendant positions required
Given the appropriate variables, you can estimate the number of attendant positions required to achieve the Speed of Answer. You need the following:
-
Erlang-C CCS Capacity Tables
-
AWT
-
AOL
-
Speed of Answer you want
Example
Take the data of the previous example:
-
AWT = 27.6 seconds
-
AOL = 47.83 CCS
-
Assuming that the Speed of Answer = 13 seconds
To determine the Average Delay in Multiples of AWT:

-
In the table shown in Total Usage, Erlang-C Infinite Queue Capacity, locate the column that most closely corresponds to the objective delay of .4710, most likely between .450 and .500, so use the .500 column.
-
Read down the column until you find the offered load closest to 47.83 CCS, most likely between 41.6 and 74.3, so use the 41.6 row.
-
Read horizontally to the left or right margin to find the number of servers required (number of servers required = 2).
Figure: Estimating attendant position requirements 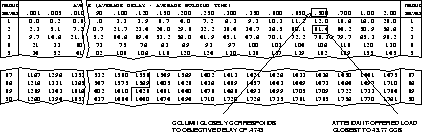
Estimating percent occupancy
To determine the percent occupancy or total time, you need
-
Number of attendant positions staffed
-
AOL
Example
For this example we continue with the previous example’s data; that is:
-
AOL = 47.83 CCS
-
# of positions staffed = 2
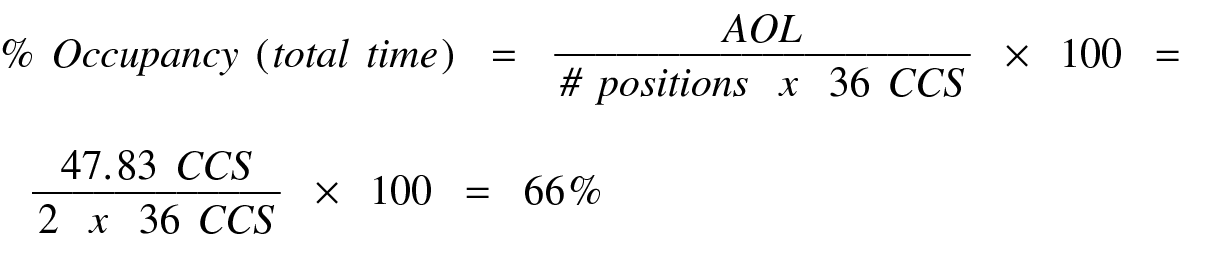
If the attendant positions are staffed 100 percent of the time, each position can handle 36 CCS of load during the peak hour.