

AVAYA DOCUMENTATION CENTER
Find answers to your technical questions and learn how to use our products
Avaya CMS Supervisor Report Designer
Category
Select the category, or database item, that you want to use as the x-axis on the chart. You can use the drop-down menu to select any of the database items you included in the query for this chart.
-
Category for X-Axis - This item is the same as the Available Items box in the Insert Query Chart Assistant. Select the database item that you want to use as the category for the chart. The Category is usually none for real-time charts, or a time database item for historical charts.There are three columns used to define the category and series for the chart. The information gathered by each column is as follows:
-
Column 1 - Category (can be none)
-
Column 2 - Series (usually Split)
-
Column 3 - Data
-
-
Show Value as Name - This item shows the selected category as a Dictionary name.
-
Format - Use the drop-down list to select the applicable formats for the selected category. If you want to view all of the available formats for all types of data, select the Show All Formats check box.
-
One Data Value Per Row - Shows one line of data when multiple rows of data are retrieved in the query. When One Data Value Per Row is selected, the first item listed in the Category for X-Axis drop-down list is the item that is used for the chart category.
Example 1
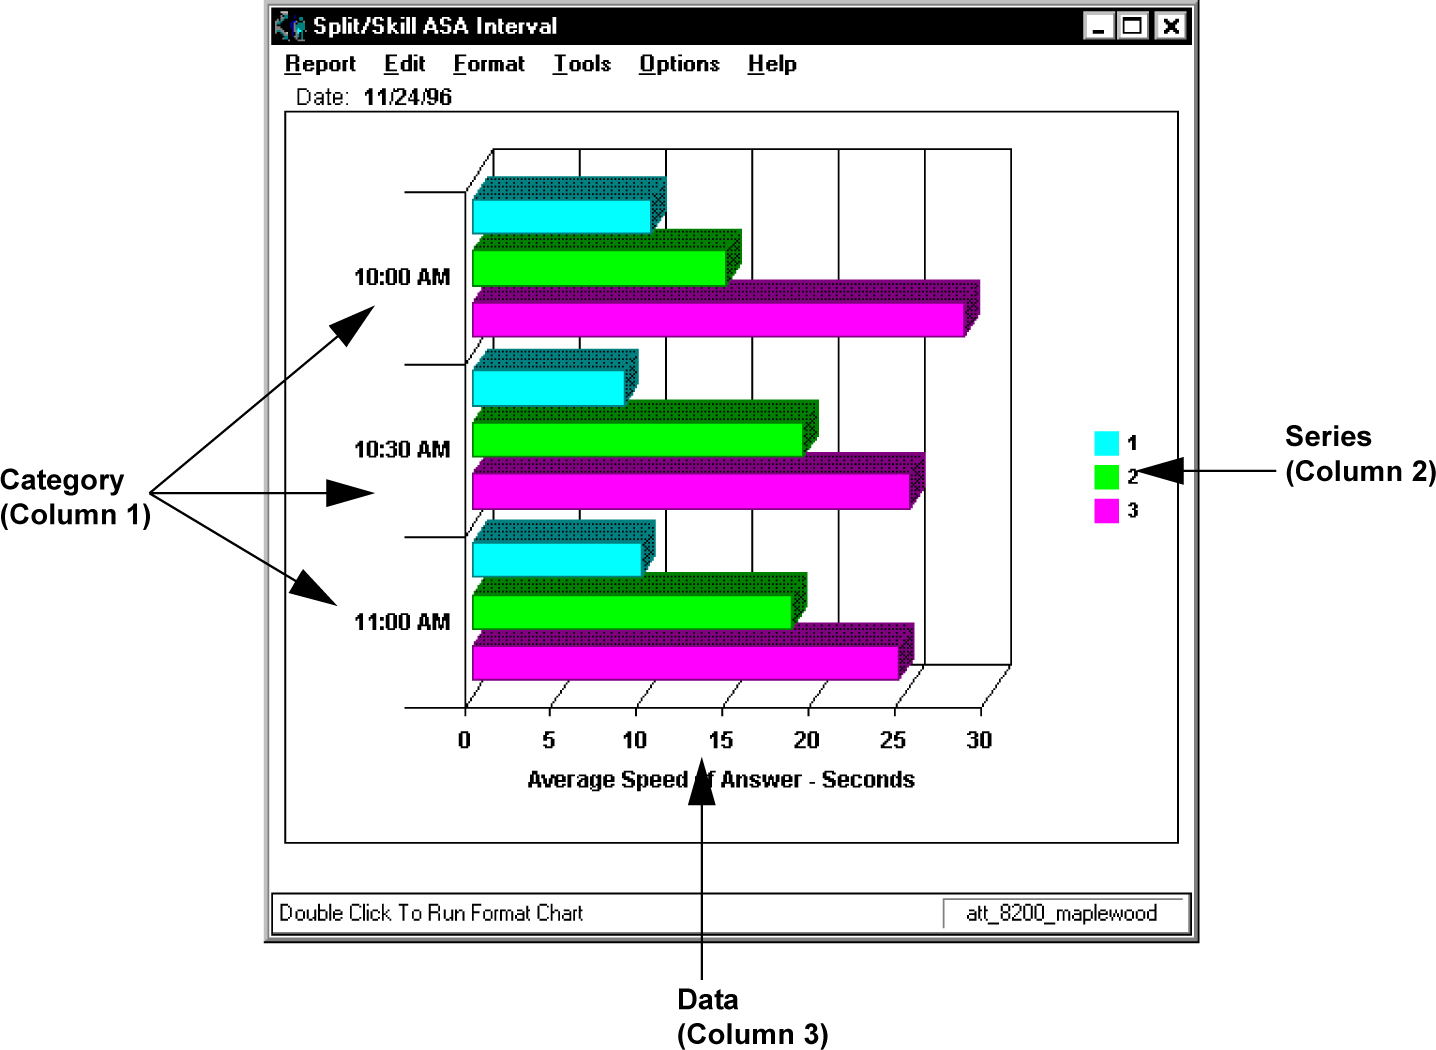
In the following example, the Category (Column 1) is the time that was selected on the input window, Series are the splits that were selected on the input window, and Data is the data that was retrieved from the CMS database for those splits/skills on the specified date for the specified time period. Also, the Show Value as Name field was not checked.
Example 2
The previous example showed a report with One Data Value Per Row selected. Following is an example of the same report, with the same Category item (STARTTIME), without One Data Value Per Row selected.

In the first example, you can see that the report shows one row of data for the interval beginning at 10:00 AM, one row of data that includes information for each split/skill for the interval beginning at 10:30 AM, and one row of data for the interval beginning at 11:00 AM. In the second example, there is a row of data shown for each split/skill for each interval.