Monitoring the system status

Last Updated : Jul 17, 2022 |

About this task

When you are experiencing problems or just want to verify that the system is in a healthy state, you can check:

  • The state of Cluster Control Manager

  • Cluster and solution chart status

  • Solution health

  • Status of Kubernetes processes on each cluster node

  • Individual pod status

  • Alarm service status

  • Avaya services registration of the system

While using this procedure to monitor your system status, if you find that your system is in a bad or unhealthy state, contact Avaya support personnel for assistance.

Procedure

  1. Check the health of Cluster Control Manager by running the ccmHealthCheck command.

    Command output details:

    • Cluster Control Manager FQDN

    • Cluster Control Manager IP address

    • Cluster storage overall status

    • Number of alarms and types of alarms

    • Operations currently running

    • NTP status: Active, Disabled, or Not reachable.

      To fix this issue, check the Resolution output section. If the NTP server is unreachable, you will be directed to run the ccmNetSetup command.

    • Node license state: Normal, Grace period, Restricted, or Unknown.

      If the license state is Grace period, Restricted, or Unknown, read the description section carefully for additional information.
      Important:

      After the 30-day licensing grace period elapses, the Common Services cluster is uninstalled. Product data is not preserved.

  2. Check the status of the cluster and product by running the ccm status command.

    Command output details:

    • Cluster status: Not deployed, Deploying, Deployed, Upgrading, Backup/Restore Status

    • List of installed products: Chart, Platform, Release, Revision, Updated on Date, Status, Namespace

    • Environment

    • Data encryption at rest policy

    • Staged products and unstaged products

    • Scheduled backup configuration

    • Archive configuration

    • Cluster storage overall status

    • Number of alarms and types of alarms

    • CSP node license state

    • Operations currently running

  3. Check the health status of the products by running the ccm status --health command.

    Command output details:

    • List of installed products:  Chart, Platform, Release, Revision, Updated on Date, Status, Namespace, Health (Healthy or Unhealthy)

  4. Check the status of processes on each cluster node by running the ccm status --ps command.

    Command output details includes the status of the following Kubernetes processes on each cluster node:

    • sdsetcd.service

    • etcd.service

    • kube-apiserver.service

    • kube-controller-manager.service

    • kube-scheduler.service

    • keepalived.service

    • flanneld.service

    • kubelet.service

    • kube-proxy.service

    • containerd.service

  5. Check the status of the pod by running the ccm status --pod-details command.

    Command output details include a list of staged products and the product pod status. The following example image shows the output of this command:


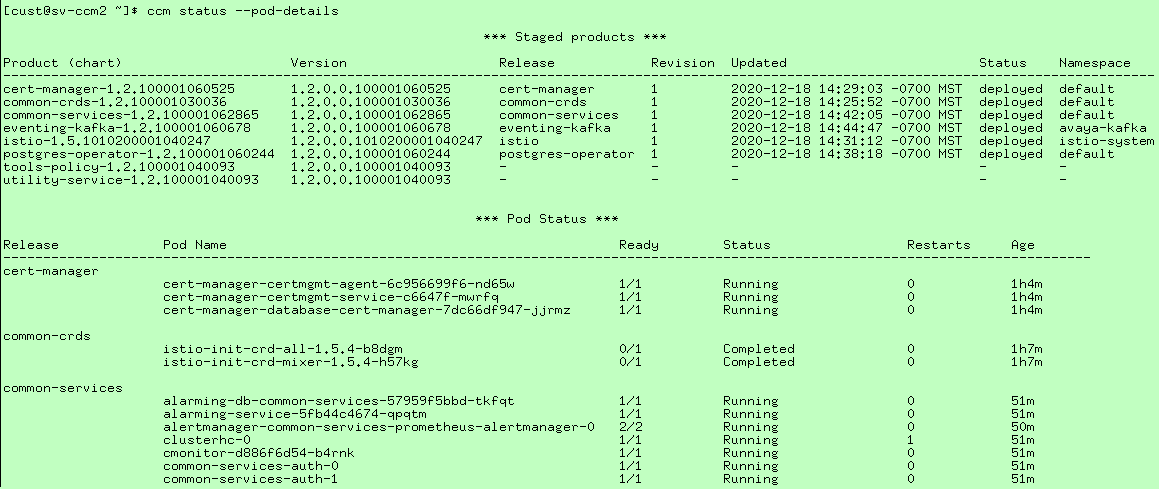
    Expectations are as follows:

    • Status is 100% of expected containers running.

    • Restarts in the single digits.

    • Age indicates how long the pod has been running. If you see a recent restart and your cluster has been up for more than 24 hours, in the next step, verify that there are no active alarms for that service or pod.

  6. Run the ccm smoke-test command.

    The following example shows the output of a successful smoke test:

    $ ccm smoke-test
    Executing Smoke Tests:
    
    This may take a few minutes...
    SDS Check:
        SDS PASSED
    192.0.2.171
    Test Results:
    
    Cluster Check Test
    PASS Smoke Test Pod Count Pass. 75/75 Pods Ready
    
    
    Ping Test:
    PASSED    kube_keepalived_vip UP
    PASSED    keepalived_vip UP
    
    Finished executing smoke tests!
  7. Check the Common Services alarm by running the ccm release common-services alarmctl -l alarmEvents command.
    Note:

    Before running this command, make sure the common-service and alarming service are running.

    Command output shows details about alarms.

  8. When the cluster is deployed, verify that the system is monitored by Avaya Services by running the displaySEID command.

    Command output details include the cluster ID, product name, version, instance, and SEID.

    If the system is not monitored or the cluster is not deployed, details are not provided.