AVAYA DOCUMENTATION CENTER
Find answers to your technical questions and learn how to use our products
Avaya CMS Supervisor Report Designer
3D Effects tab
Use the 3D Effects tab to control the 3D appearance of the chart. If the current chart is a 2D chart, this tab is disabled.
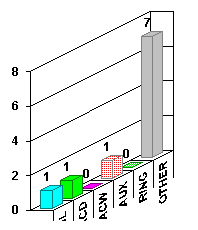
Example
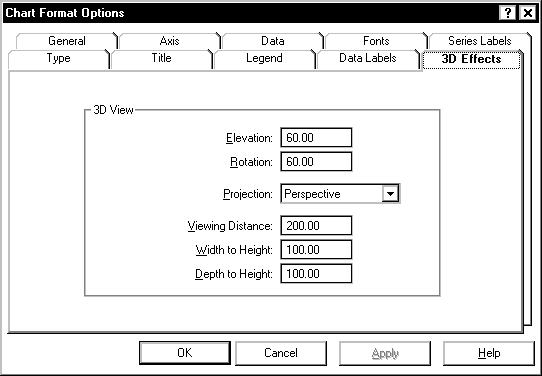
3D Effects tab options
You can change the following parameters.
Name |
Description |
|---|---|
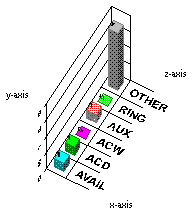
Elevation |
This is a number from 0 through 90 degrees, and describes the relative height from which a chart is viewed. An elevation of 90 looks directly down on the top of the chart, while an elevation of 0 looks directly at the side of the chart. The example charts throughout this document use an elevation of 30 degrees. |
Rotation |
This is a number from -360 through 360 degrees, and specifies the angle that the chart is turned relative to the viewing position. The example charts throughout this document use a rotation of 60 degrees. Rotation does not apply to 3D pie charts. |
Projection |
This selects one of three mathematical algorithms used to give a 3D appearance on a 2D sheet of paper or computer screen. The following values can be chosen:
 Perspective: This provides the most realistic 3D appearance. Objects farther away from you converge toward a vanishing point. 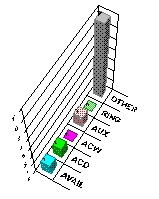 |
Viewing Distance |
This is a number from 50 through 1000 that represents the distance from which the chart is viewed as a percentage of the depth of the chart |
Width to Height |
This is a number from 5 through 2000 that represents the percentage of the chart’s height that is used to draw the chart’s width. |
Depth to Height |
This is a number from 5 through 2000 that represents the percentage of the chart’s height that is used to draw the chart’s depth. |