AVAYA DOCUMENTATION CENTER
Find answers to your technical questions and learn how to use our products
Avaya CMS Supervisor Report Designer
Data Labels tab
Use the Data Labels tab to define where the labels of each data point on the chart will be displayed and to define how the labels will be displayed.
Example
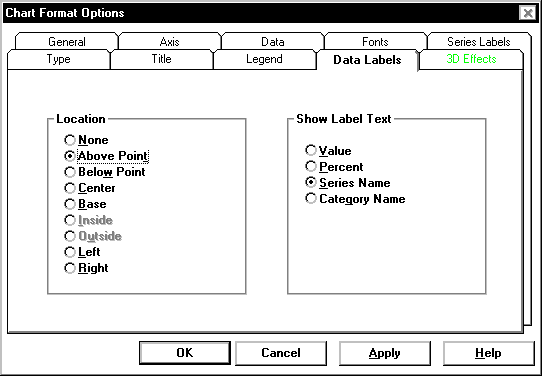
Data Labels tab options
You can specify the following parameters.
Name |
Description |
|---|---|
None |
No labels are displayed. |
Above Point |
The label is displayed above the data point. This location is valid only for bar, line, area, and step charts. |
Below Point |
The label is displayed below the data point. This location is valid only for bar, line, area, and step charts. |
Center |
The label is displayed below the data point. This location is valid only for bar, line, area, and step charts. |
Base |
The label is displayed along the category axis, directly beneath the data point. This location is valid only for bar, line, area, and step charts. |
Inside |
The label is displayed inside a pie slice. This location is valid only for pie charts. |
Outside |
The label is displayed outside a pie slice. This location is valid only for pie charts. |
Left |
The label is displayed to the left of the related data point. |
Right |
The label is displayed to the right of the related data point. If data point labels are displayed, you can specify that they include one of the following display options |
Value |
The value of the data point displays in the label. |
Percent |
The value of the data point displays in the label as a percentage. |
Series Name |
The series name is used to label the data point |
Category Name |
The category name is used to label the data point. |
If data point labels are displayed, you can specify that they include one of the following display options:
The position of data point labels can affect the readability of the chart. The label text may overlap in some situations, making it difficult or impossible to read the labels.