AVAYA DOCUMENTATION CENTER
Find answers to your technical questions and learn how to use our products
Avaya CMS Supervisor Report Designer
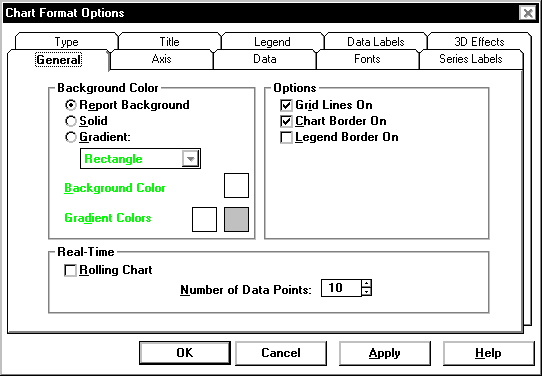
General tab
Select the General tab to specify several general options that apply to the chart.
Example
General tab options
You can change the following chart parameters.
Name |
Description |
|---|---|
Background Color |
You can specify whether the backdrop of the chart is a solid color or whether it is displayed as a gradient. The gradient transition can be one of the following options: horizontal, vertical, rectangle, or oval. The quality of the gradient effect will vary depending on what video card is installed in the PC. The quality of the gradient effect for printed reports depends on the capabilities of the printer. |
Options |
Select the check boxes, as appropriate, to include or omit grid lines, chart borders, and legend borders on the report. |
Real-Time |
If the chart is part of a real-time report and is a rolling chart, you can specify the number of data points to be displayed in the chart. Permitted values are 2 through 100, with 10 the default. A rolling chart is a line chart that is initially displayed with no data points. For each refresh of the report, a data point is added. As data points are added, the chart |