AVAYA DOCUMENTATION CENTER
Find answers to your technical questions and learn how to use our products
Avaya CMS Supervisor Report Designer
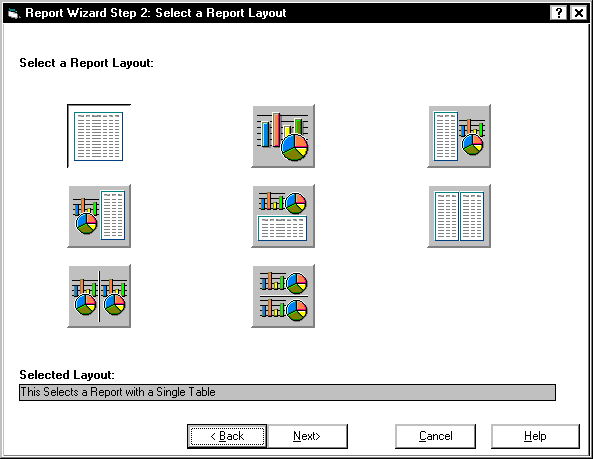
The Select a Report Layout page
Your second task is to choose a report layout. The layout determines how your data will be represented in the report. Report layouts can be charts, tables, or both. Charts provide a graphical representation of data, and tables provide data in columns and rows. Select the icon that represents the layout you want.