

AVAYA DOCUMENTATION CENTER
Find answers to your technical questions and learn how to use our products
Configuring Workflows for Avaya Experience Platform Public Cloud
Dynamic path
Use a dynamic path to define a different path in a flow depending on the respondent answers. A flow is a sequence of interactions with all available paths. By default, Automation presents interactions in the order that you specify on the Basic tab. However, on the Dynamic path tab, you can configure a specific path and make it default for the flow. Automation marks the default path with the tag <default>.
Modes
Automation has two modes to manage a dynamic path:
-
EditorYou can use this mode to edit a path.
-
VisualizerYou can use this mode to view a complete flow and check its correctness.
Dynamic path visualization
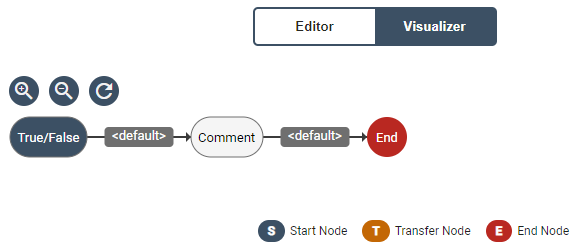
Automation represents a dynamic path in the form of a flowchart. The flowchart has the following element types:
|
Element
|
Description
|
Color Code
|
|---|---|---|
|
Start node
|
The entry point
|
Navy blue
|
|
Transfer node
|
The point of transfer to an agent
|
Orange
|
|
End node
|
The endpoint
|
Red
|
|
Common node
|
The node in the middle of a flow
|
White
|
For interpretation, all windows with the flowchart contain the legend with the key elements.
In the flowchart, Automation marks arrows leading to a target element with a tag. Tags help to identify paths and visually represent the setting that you configure. It can be a default tag or a tag that you specify while editing the dynamic path in the Editor mode.