

AVAYA DOCUMENTATION CENTER
Find answers to your technical questions and learn how to use our products
Maintaining and Troubleshooting Avaya Analytics™ for Avaya Oceana®
Viewing AIDE logs in the Kibana logging interface
You can use the Kibana logging interface to view AIDE logs from the Elasticsearch server. Currently, the Kibana interface displays AIDE logs for cluster nodes. You cannot use this procedure to view AIDE logs from Cluster Control Manager.
Before you begin
-
Ensure that file integrity validation is enabled. By default, the file integrity validation software runs every day at 3:00 a.m.
-
Ensure that you know how to create index patterns in Kibana.
- Log in to Kibana using the URL https://<cluster-FQDN>/logging.
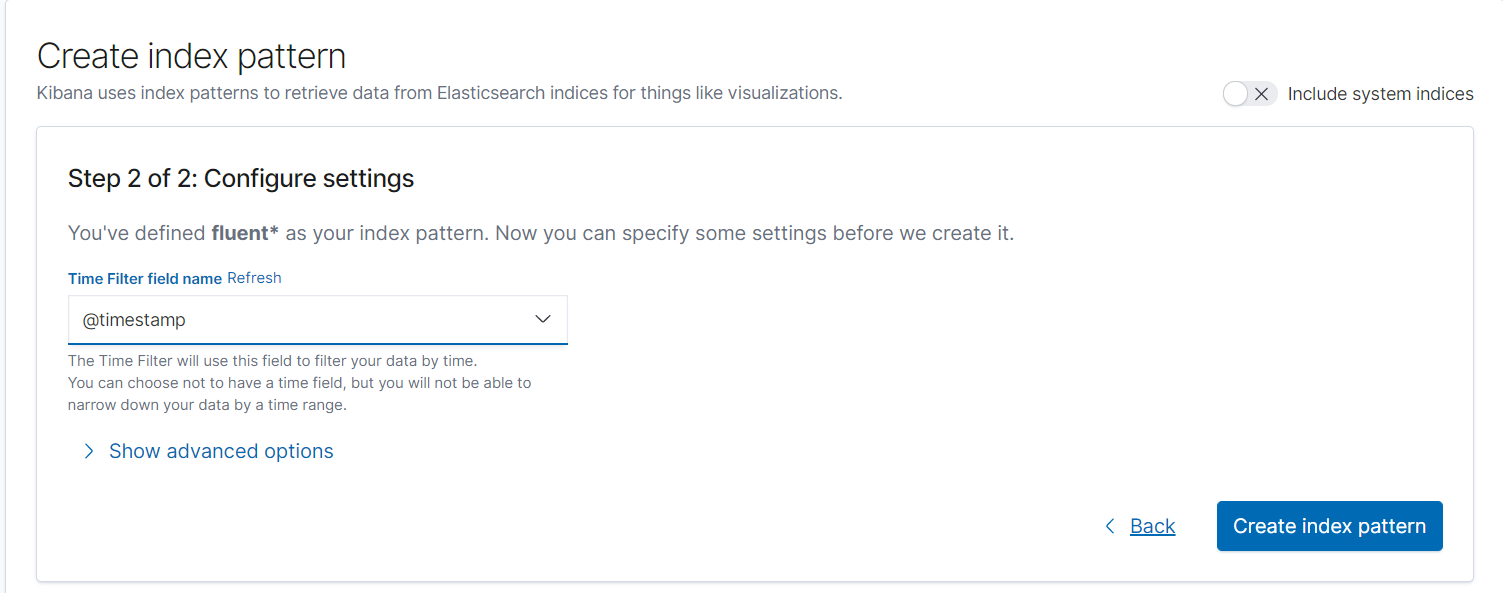
- Create an index pattern called fluent-k8saudit* if one does not already exist.
ADDITIONAL INFORMATION:From the Time Filter field name drop-down menu, ensure that you select @timestamp and then click Create index pattern to complete the process.
- Open the Discover view by clicking
 on the left side of the screen.
 - To view AIDE logs from all servers, do the following:
- Type tag_all:(k8saudit.instanceaide) in the Search field.
- Select a time range.
- To view AIDE logs for specific servers, do the following:
- Run the
k get nodes -o widecommand and find your host IP addresses in theINTERNAL-IPcolumn.[root@flex-140 ~]# k get nodes -o wide
NAME STATUS ROLES AGE VERSION INTERNAL-IP EXTERNAL-IP OS-IMAGE KERNEL-VERSION CONTAINER-RUNTIME
flex-143.dr.example.com Ready controller-worker 5d14h v1.22.2 192.0.2.143 <none> Red Hat Enterprise Linux 8.5 (Ootpa) 4.18.0-348.20.1.el8_5.x86_64 containerd://1.5.7
flex-144.dr.example.com Ready controller-worker 5d14h v1.22.2 192.0.2.144 <none> Red Hat Enterprise Linux 8.5 (Ootpa) 4.18.0-348.20.1.el8_5.x86_64 containerd://1.5.7
flex-145.dr.example.com Ready controller-worker 5d14h v1.22.2 192.0.2.145 <none> Red Hat Enterprise Linux 8.5 (Ootpa) 4.18.0-348.20.1.el8_5.x86_64 containerd://1.5.7
- Run the
- To filter logs by their messages, select message from the list of available fields and then click add.