AVAYA DOCUMENTATION CENTER
Find answers to your technical questions and learn how to use our products
Implementing and Administering Avaya Aura® Media Server
Viewing details for a specific session
About this task
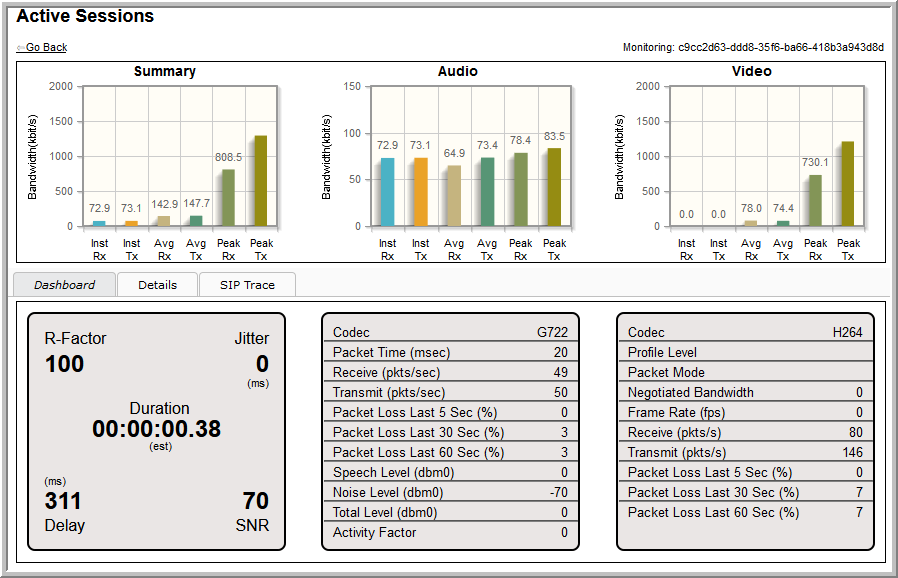
The Active Sessions page is a useful debugging tool to use when you encounter difficulties. There are options available to collect data for analysis. These options include graphical SIP message flows and SIP traces which show the details of the messages for a particular session.
Perform the following procedure to collect a message trace of a session:
Procedure
- Click Monitor Next or select a session in the list, and click Monitor.
EM displays a message that the system is waiting for a new session to start.
After the next session arrives, the system displays the Active Sessions page with a detailed call performance summary.
Click on Details to display the SIP messages.