AVAYA DOCUMENTATION CENTER
Find answers to your technical questions and learn how to use our products
Implementing and Administering Avaya Aura® Media Server
Monitoring alarms
About this task
Avaya Aura® MS generates an active alarm any time Avaya Aura® MS detects an operational error condition that requires corrective action by the administrator.
Avaya Aura® MS contains many individual system components that perform specific functions during operation. When a component detects an error condition the component raises an alarm. The component that raises the alarm automatically clears the alarm after the administrator resolves the error condition.
The system generates an event log each time a component raises or clears an alarm. The event log provides a clear record of all state changes on Avaya Aura® MS long after the error condition is resolved.
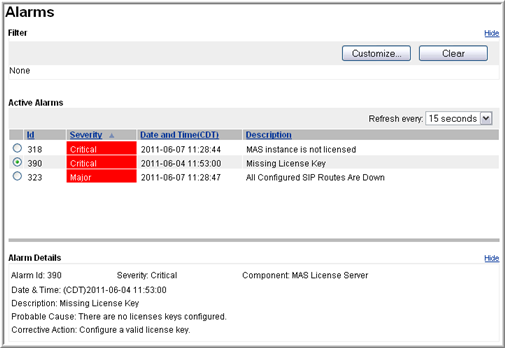
You can view the list of active alarms in the EM alarm viewer. The system updates the alarm viewer by using a refresh interval that you select.
EM displays the following information for each alarm:
Alarm field descriptions |
|
|---|---|
Field |
Description |
ID |
A unique identifier assigned to the alarm. |
Severity |
The severity rank of alarms from most severe to least severe is Critical, Major, Minor, and Warning. |
Date and Time |
The timestamp of the exact time the alarm is raised. You can configure timestamps to display as either local time or Universal Time Coordinated (UTC) time. UTC time can be useful for correlating alarms with events in other time zones. |
Description |
A description of the type of error condition encountered. |
Component |
The name of Avaya Aura® MS software component reporting the alarm. |
Probable Cause |
A description of the probable cause of this alarm. |
Corrective Action |
A suggested corrective action that can be performed to resolve the error condition. |
Perform the following procedure to view the active alarms on Avaya Aura® MS:
Procedure
- To set the alarm data refresh interval, use the Refresh every drop-down menu.
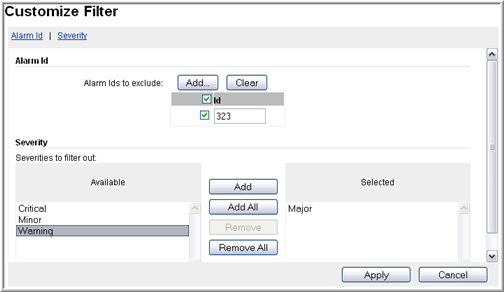
- Click Customize... in the upper-right corner of the Alarms pane to create a filter for the displayed alarms.