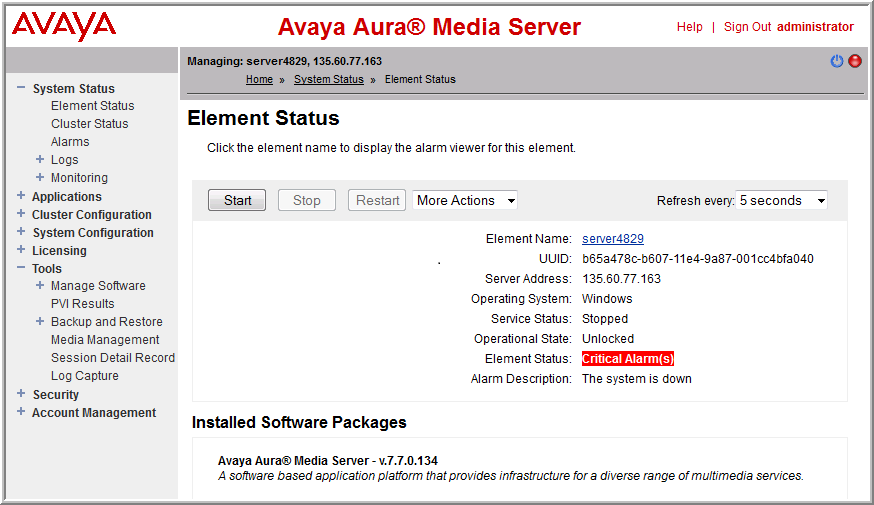
The Element Manager (EM) layout includes a branding banner at the top, a task pane at the left, a content pane at the right for management activities, and a navigation bar at the top of the content pane. The upper-right corner of the EM page has Help and Sign out links and displays the user ID of the currently signed-in user.
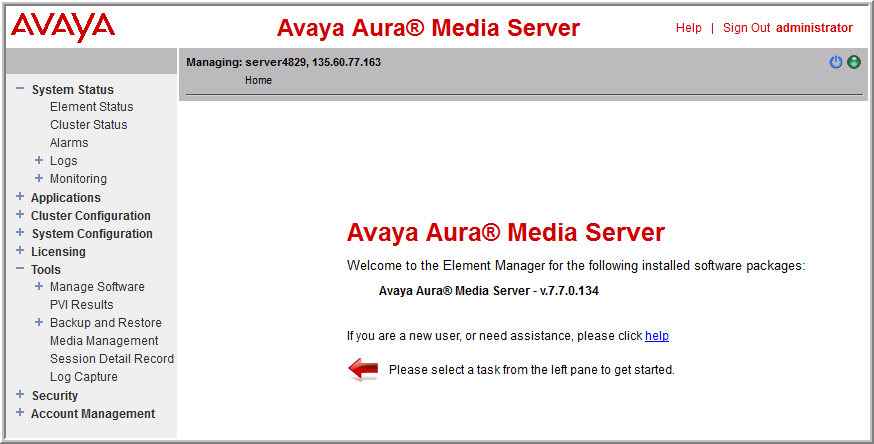
The system displays the Home page after initial login. The content pane displays the welcome message, the version of Avaya Aura® MS installed, and a message to assist your administrator to get started.
The navigation bar is located under the branding banner. The navigation bar includes the host name, the management IP address of the component that you are managing, and the navigation history, known as breadcrumbs, reflecting the location of the current task within the task hierarchy. The navigation breadcrumbs are active links that you can use to return to previously accessed areas.
The right side of the navigation bar displays icons to alert you of the Avaya Aura® MS alarms and restart states.
EM displays a round colored icon representing the alarm state of Avaya Aura® MS. Hovering your mouse cursor over the alarm reveals the most severe active alarm. Clicking on the alarm icon displays the Alarms page with details about all the currently active alarms. EM displays the following alarm levels:
Critical
Major
Minor
Normal
When configuration items that require a restart to take effect have been saved, EM displays a restart icon next to the alarm status icon to indicate that you must perform an Avaya Aura® MS restart. EM clears the icon after the Avaya Aura® MS restarts.
The tasks pane on the left lists all the actions that an administrator performs for Avaya Aura® MS OAM. The actions are grouped into categories as follows:
Actions
Description
System Status
Presents a view of the current and historical information pertaining to the status of the system. These tasks includes:
element status
alarm viewing
cluster status
event log viewing
monitoring
The monitoring task includes:
performance monitoring
operational measurements
protocol monitoring of Avaya Aura® MS
The active session monitoring includes graphical SIP message flows and SIP traces and displays details of messages for a particular session.
Cluster Configuration
Provides tasks for server designation, replication settings, clustering and high availability configuration, and load balancing settings.
System Configuration
Categories include: server profiles, network settings, signaling protocols, media processing, application interpreters, monitoring settings, session detail records, engineering parameters, EM settings, and SIP routing. The administrator can view and modify Avaya Aura® MS platform configuration.
Licensing
Provides an interface to configure and monitor the licensing services.
Tools
Provides utilities to view which software versions are installed. It performs a backup or restore of system and customer data, manage media, view session detail records, and collect logs.
Security
Provides an interface for Security related configuration.
Account Management
Manage administrators, roles, and permissions for Avaya Aura® MS EM users.
 Critical
 Major
Major Minor
Minor Normal
 next to the alarm status icon to indicate that you must perform an Avaya Aura® MS restart. EM clears the icon after the Avaya Aura® MS restarts.