AVAYA DOCUMENTATION CENTER
Find answers to your technical questions and learn how to use our products
Implementing and Administering Avaya Aura® Media Server
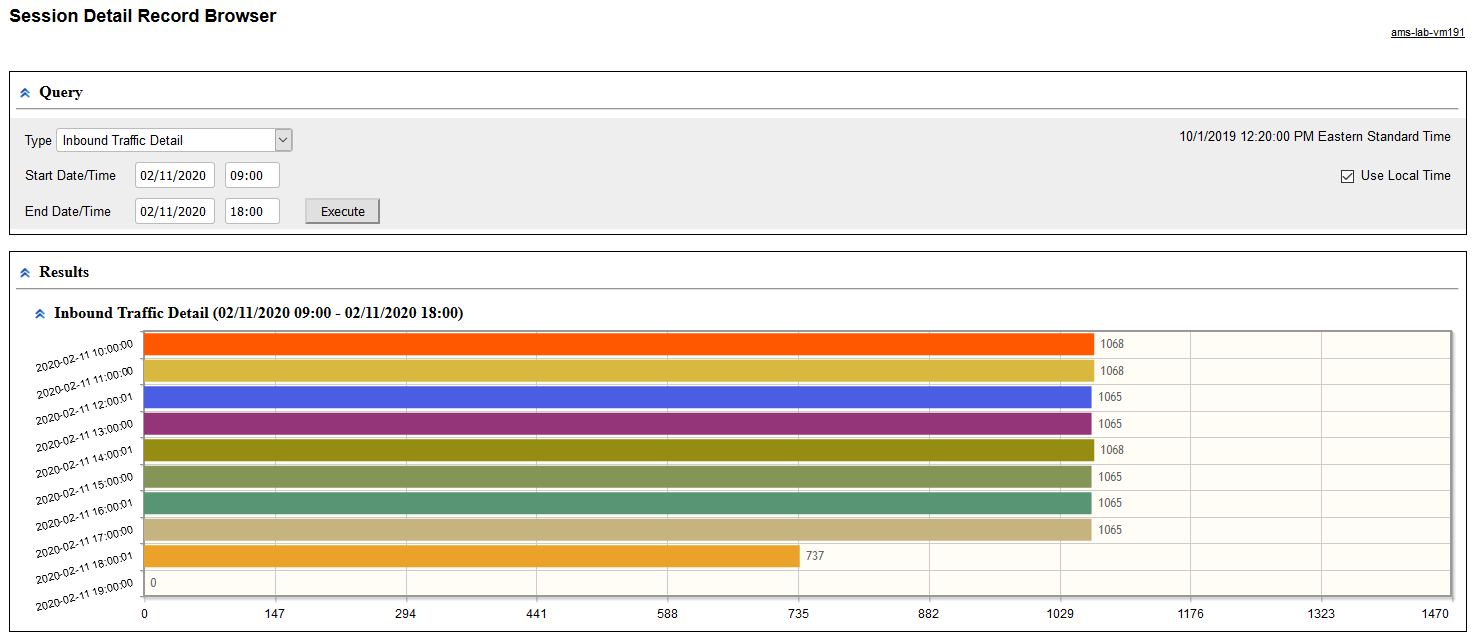
Analyzing hourly inbound traffic details
About this task
Perform the following procedure to generate graphical reports for determination of hourly traffic processed by the Avaya Aura® MS:
Procedure
- Click Execute to run the new query and generate a graph showing hourly inbound session totals. Move your cursor over any bar graph element to see the number of sessions recorded for that hour.