

AVAYA DOCUMENTATION CENTER
Find answers to your technical questions and learn how to use our products
Using Customer Operations Manager for IP Office Subscription Systems
Using the Dashboard
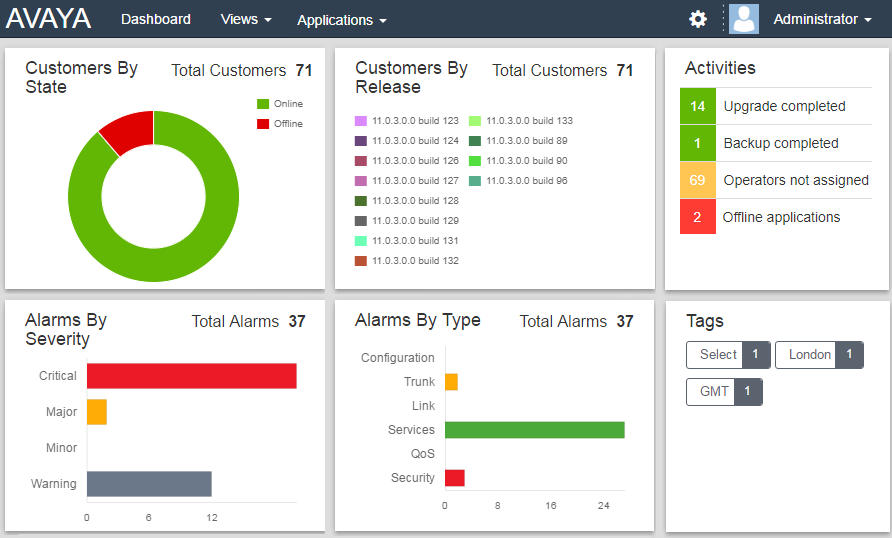
This is the default view presented when you login.
-
For components on the dashboard that have a legend, for example Customers By State, clicking on items in the legend hides them in the component chart.
Many parts of the dashboard can be clicked to jump to a filtered list of matching entries. For example:
-
Clicking on a tag in the Tags panel will take you to the customer list pre-filtered to only show systems with the same tag. See customer list.
-
Clicking on an alarm type or severity in the Alarms By Severity or Alarms By Type panels will take you to the alarms list pre-filtered to only show matching alarms. See alarms list.
You can return to the main dashboard at any time by clicking on Dashboard in the menu bar.