AVAYA DOCUMENTATION CENTER
Find answers to your technical questions and learn how to use our products
Avaya Aura Presence Services Snap-in Reference
presGraphMetrics
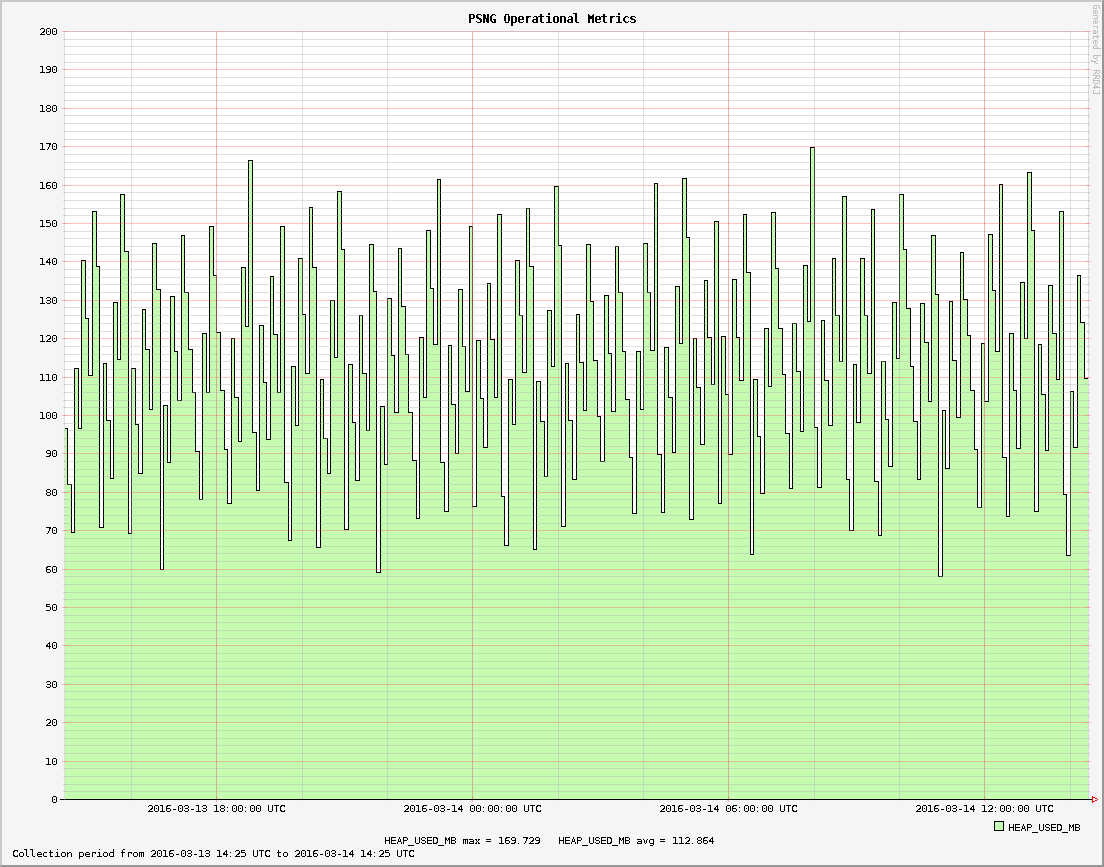
This command is used to get graph historical metric data generated by the presCollectMetrics command-line tool. The --help parameter displays how it is used.
Syntax
presGraphMetrics -f CSV Filename -T1|24 -t
Options:
-
—f: File name.
-
—T1|T24: T1 will display the metrics from the last hour. T24 will display the metrics from the last 24 hours.
-
—t: Total count
Sample output 1
# presGraphMetrics --help
 Invalid option: --
 Presence Services Graph Metrics Tool
  Usage: presGraphMetrics -f <CSV Filename> -T<1|24> <Column Names To Graph ...>
  e.g. presGraphMetrics -f psng-gigaspaces.csv -T24 THREAD_COUNT WRITE READ
  -t show Total Count
  where T 1 = Last hour or 24 = Last 24 hours
Sample output 2
# presGraphMetrics -f ./psng-gigaspaces-0160314102531.csv -T24 HEAP_USED_MB
== Graph completed in 1.056 sec
 filename = "psng-20160314103301.png"
 width = 1104, height = 867
 byteCount = 32778
 imginfo = "<img src='psng-20160314103301.png' width='1104' height = '867'>"
 No print lines found

 Wrote : psng-20160314103301.png
The resulting PNG graphics file can be loaded by an image viewing program.